Leaf area calculations
Leaf area calculations
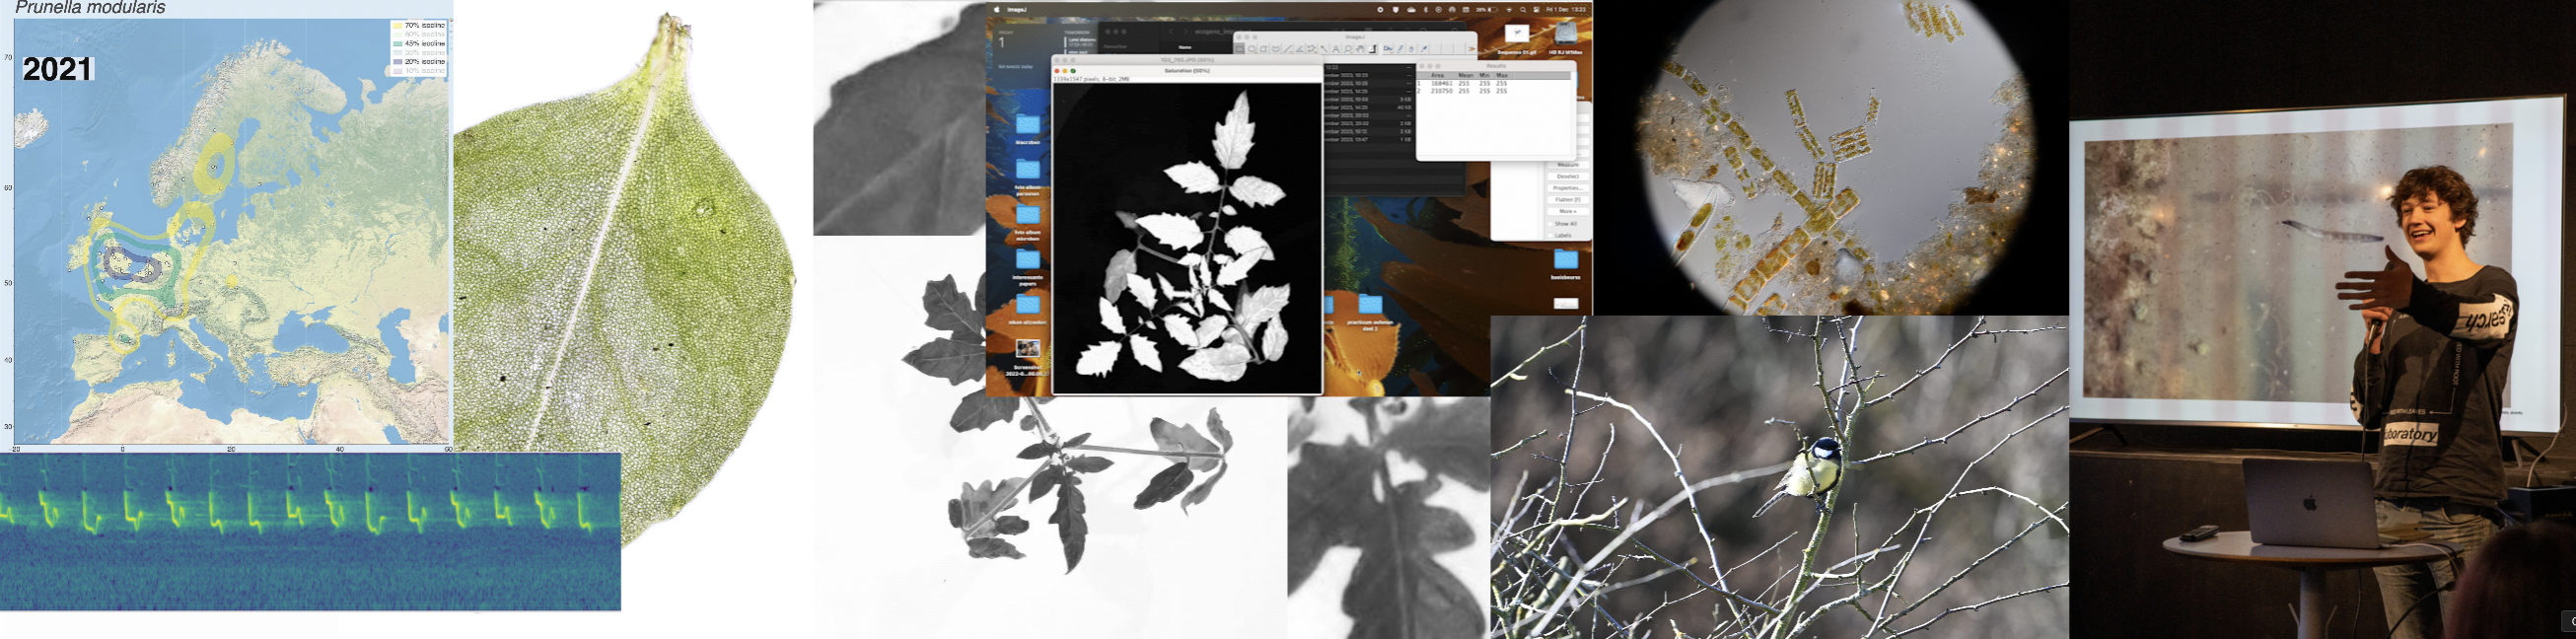
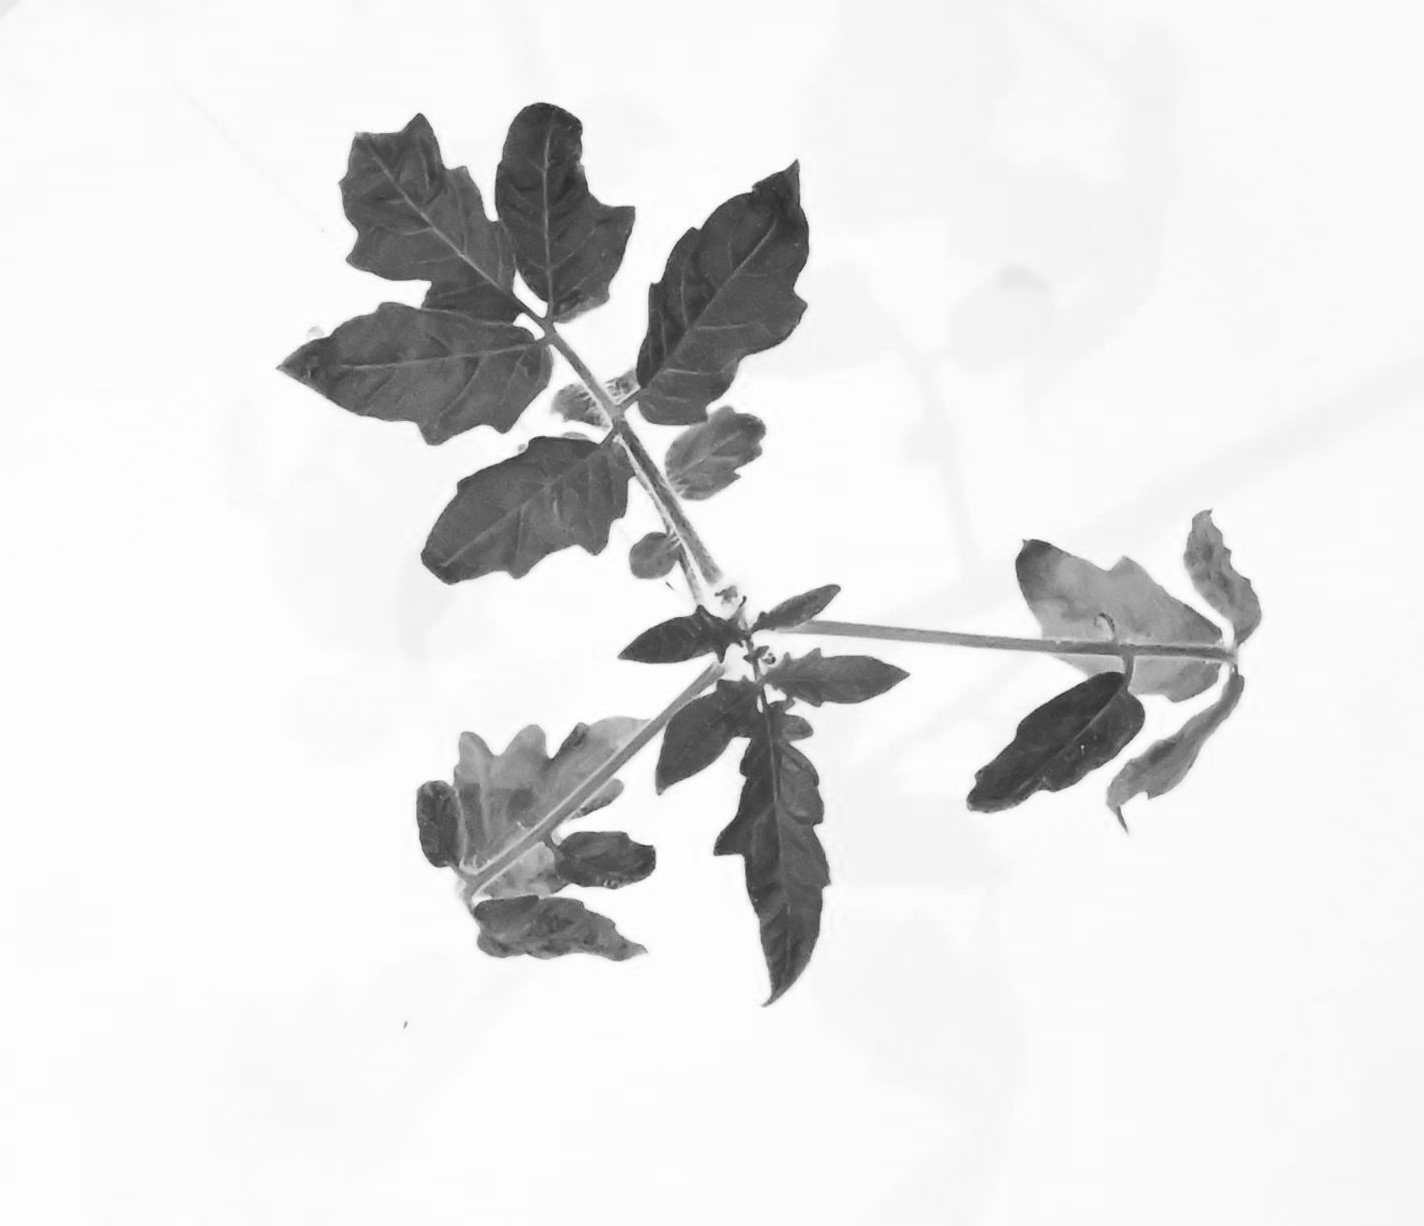
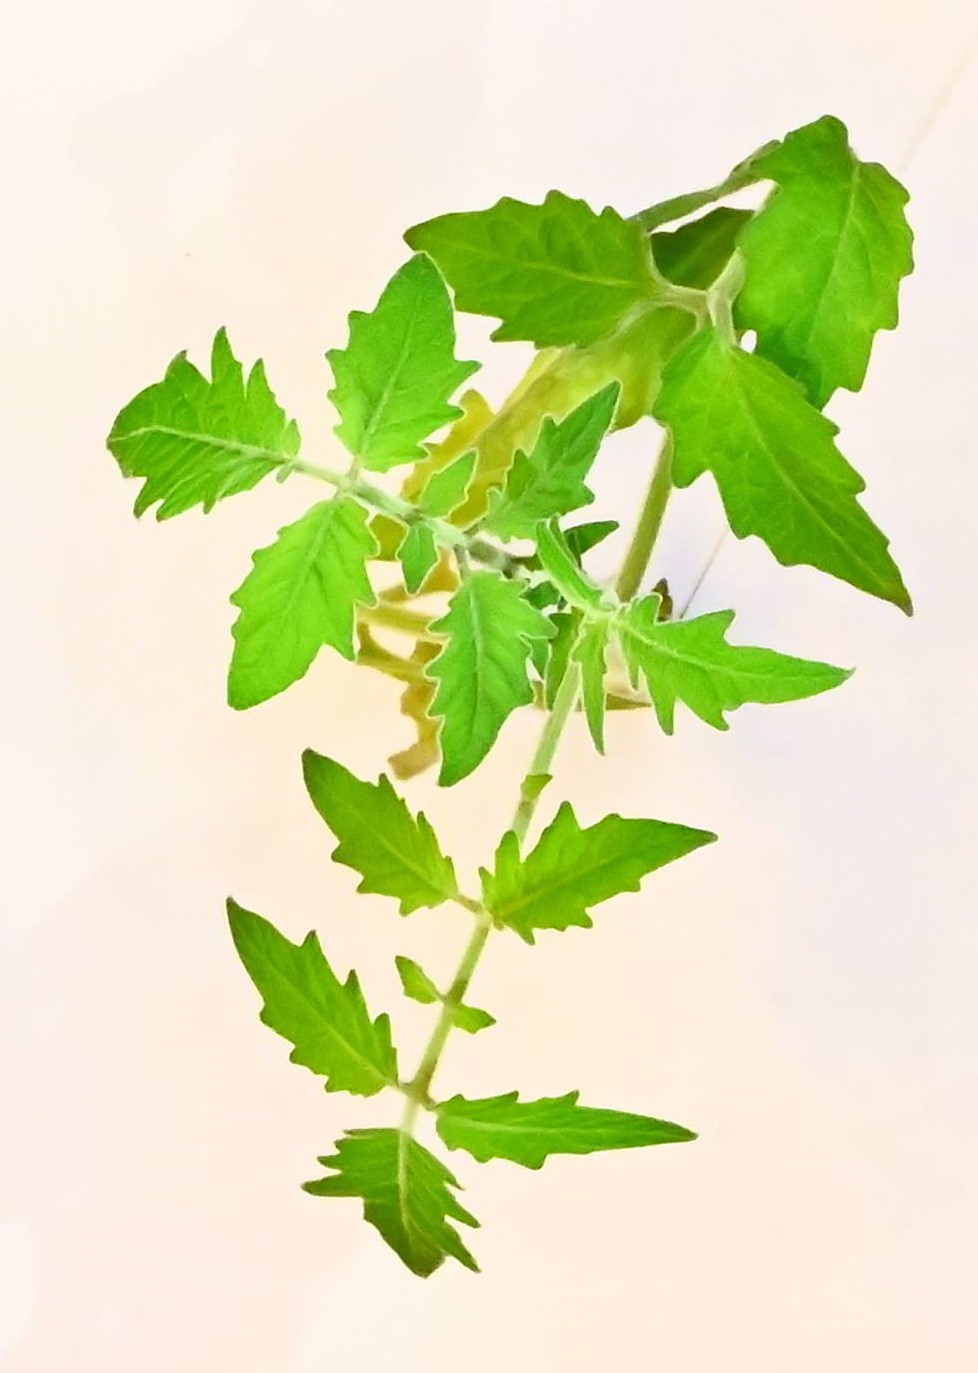
While trying to phenotype 360 individual tomato plants Solanum lycopersicum it became very apparent why high-throughput phenotyping relies on computers to do most of the work. I wanted to have acces to image recognition software but I could not find a free version. With the help of ChatGPT this very rudimentary algorithm calculates leaf area based on HSB color values.
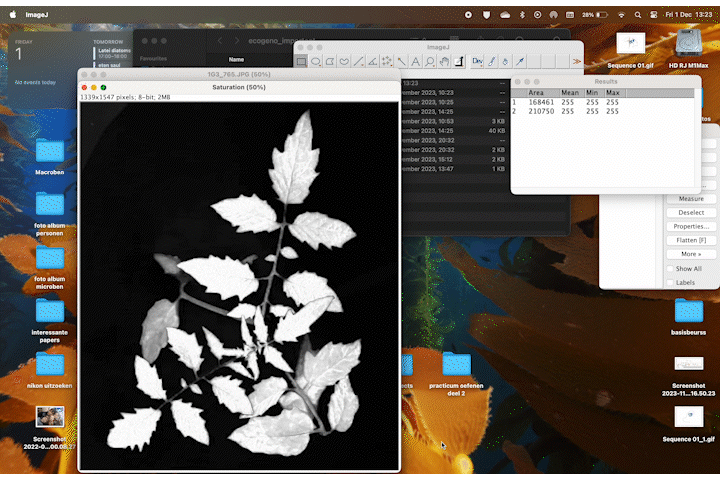
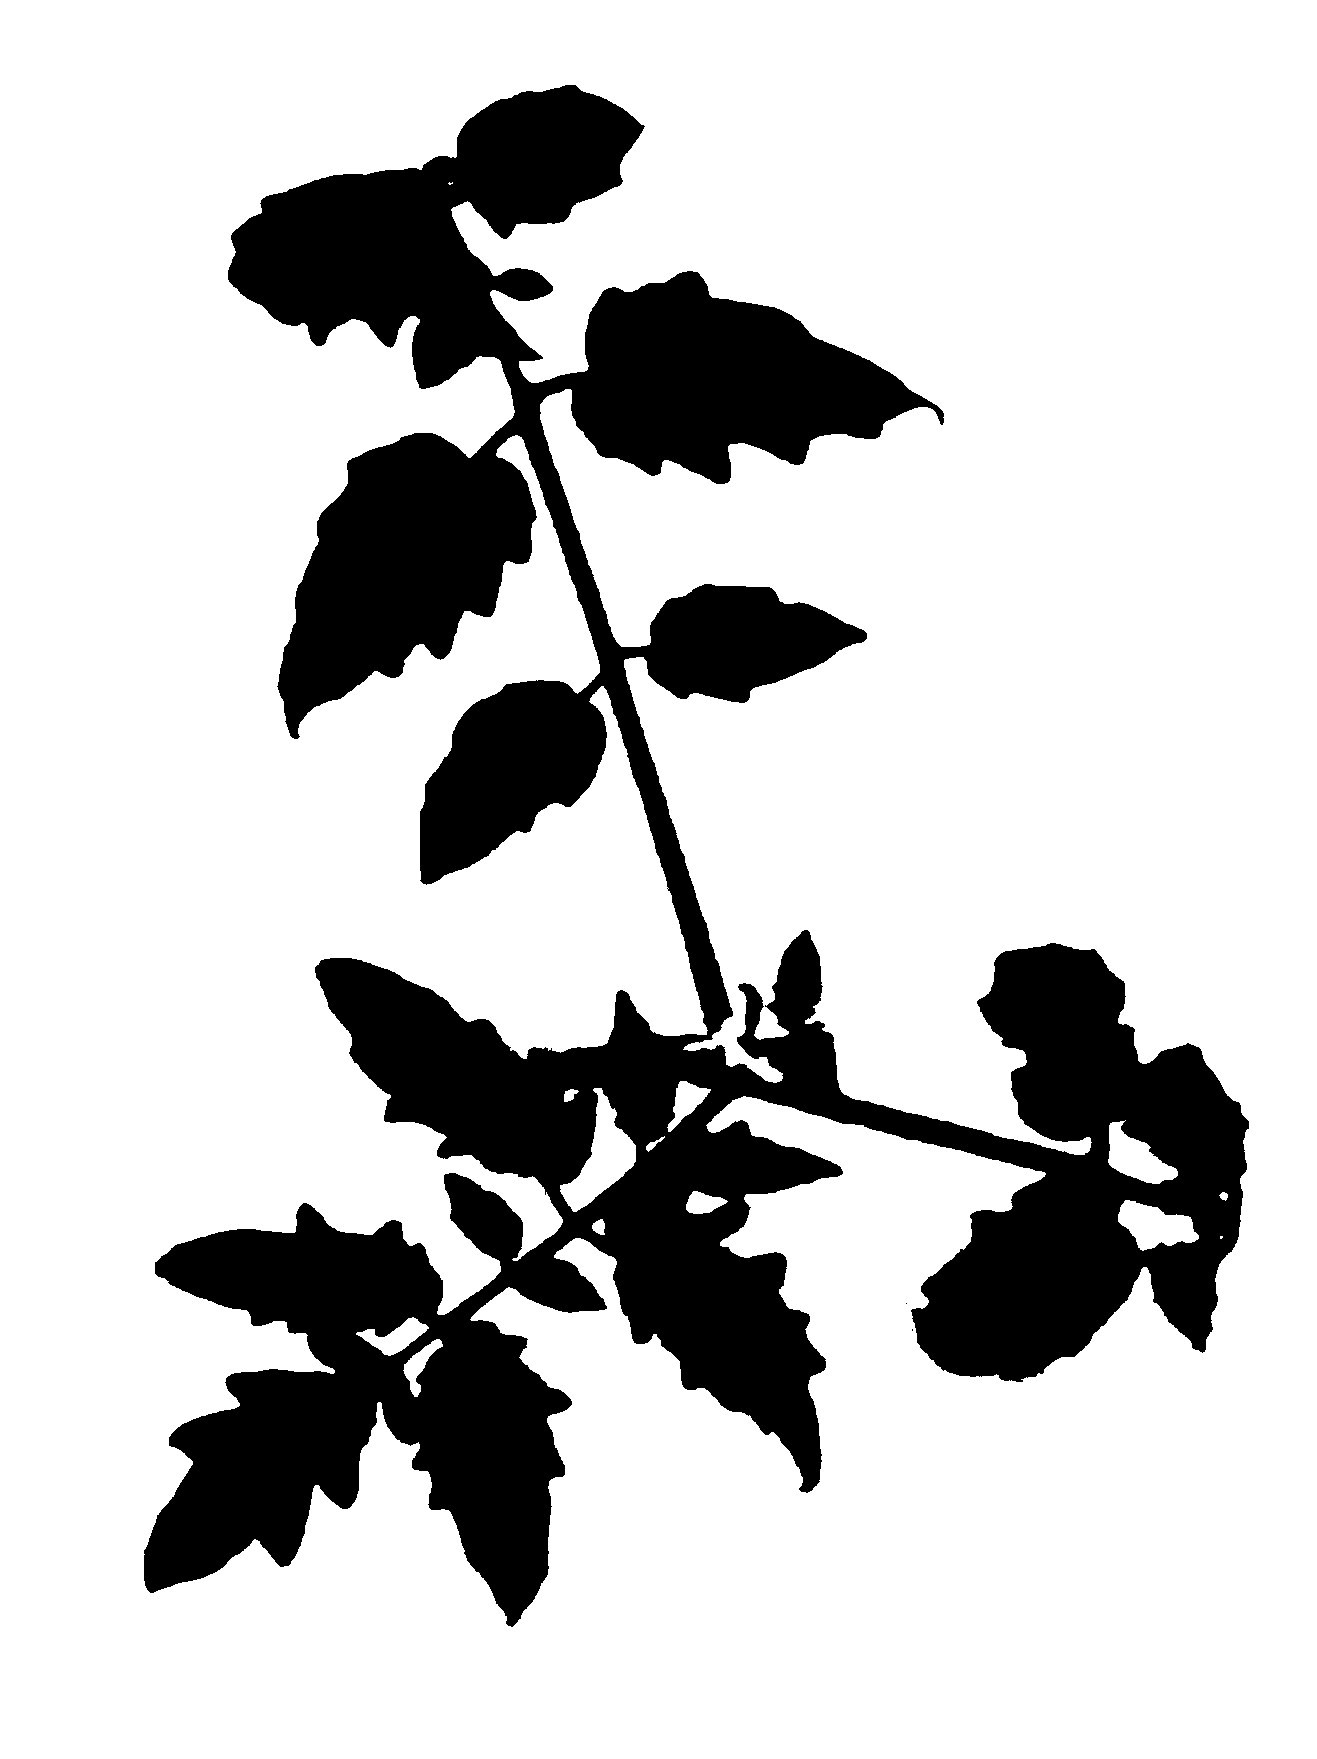
It accurately calculates the area of the plant 70% of the time, and it stores the area values in a table. If we rerun the macro multiple times wit different thresholds the combined accuracy is about 85%.
Code
Here is the macro code. I suggest creating a txt file and running it in ImageJ using plugins -> macros -> run -> txt_file.txt. This macro will input a folder with jpgs inside, it will output into a new or existing folder the binary images used for calculations, and the area values of each separate area from biggest to smallest:
// Define the directory paths
inputDir = "/Users/admin/Desktop/ecogeno_important/all_input_fotos/";
outputDir = "/Users/admin/Desktop/ecogeno_important/all_output_tables/";

// Get a list of all the files in the input directory
list = getFileList(inputDir);

// Loop through each file
for (i = 0; i < list.length; i++) {

    // Open the image
    open(inputDir + list[i]);

    // Set scale
    run("Set Scale...", "distance=0 known=250 pixel=1 unit=cm");

    // Convert to HSB and split channels
    run("HSB Stack");
    run("Stack to Images");

    // Adjust these values based on your specific plant color
    minHue = 0; // Minimum Hue
    maxHue = 120; // Maximum Hue
    minSat = 50; // Minimum Saturation
    maxSat = 255; // Maximum Saturation
    minBright = 50; // Minimum Brightness
    maxBright = 255; // Maximum Brightness

    // Select and threshold the Hue channel
    selectWindow("Hue");
    setThreshold(minHue, maxHue);
    run("Convert to Mask");

    // Select and threshold the Saturation channel
    selectWindow("Saturation");
    setThreshold(minSat, maxSat);
    run("Convert to Mask");

    // Select and threshold the Brightness channel
    selectWindow("Brightness");
    setThreshold(minBright, maxBright);
    run("Convert to Mask");

    // Combine the masks and analyze particles
    imageCalculator("AND create", "Hue","Saturation");
    imageCalculator("AND create", "Result of Hue","Brightness");
    selectWindow("Result of Result of Hue");
    run("Analyze Particles...", "size=500-Infinity circularity=0.00-1.00 show=Outlines display clear");
    roiManager("Measure");

    // Save the results in the output directory with the same file name
    selectWindow("Results");
    saveAs("Results", outputDir + File.nameWithoutExtension + "_results.csv");

    // Save the image with outlines
    selectWindow("Result of Result of Hue");
    run("Duplicate...", "title=Outline");
    run("Flatten");
    saveAs("Jpeg", outputDir + File.nameWithoutExtension + "_outline.jpg");
    close("*");
}

// Close all open windows
close("*");
You can combine the values from all tables using these two python scripts
The first adds up all the area’s in an image into a single value:
import os
import pandas as pd

def process_csv_files(input_folder, output_folder):
    # Ensure output folder exists
    if not os.path.exists(output_folder):
        os.makedirs(output_folder)

    # Iterate through each file in the input folder
    for file_name in os.listdir(input_folder):
        if file_name.endswith('.csv'):
            file_path = os.path.join(input_folder, file_name)
            output_file_path = os.path.join(output_folder, file_name)

            try:
                # Read the CSV file
                df = pd.read_csv(file_path)

                # Check if the first column has numeric data
                if df.iloc[:,1].dtype.kind in 'biufc':
                    # Sum the values in the first column, skipping the header
                    total = df.iloc[:,1].sum()
                    totalcm = round((total/6437.17), ndigits=2)

                    # Create a new DataFrame with the sum
                    df_sum = pd.DataFrame([totalcm])

                    # Save the sum to a new CSV file
                    df_sum.to_csv(output_file_path, index=False, header=[df.columns[0]])
                else:
                    print(f"Skipping {file_name}: Non-numeric data in the first column.")
            except Exception as e:
                print(f"Error processing {file_name}: {e}")

# Usage
input_folder = '/Users/admin/Desktop/ecogeno_important/all_output_tables'  # Replace with your input folder path
output_folder = '/Users/admin/Desktop/ecogeno_important/clean_output_tables' # Replace with your output folder path

process_csv_files(input_folder, output_folder)
This second script combines all total area values per image into a single large table
import pandas as pd
import os

def consolidate_csv(folder_path, output_folder, output_file):
    # Create the output folder if it doesn't exist
    if not os.path.exists(output_folder):
        os.makedirs(output_folder)

    # List to hold all values
    all_values = []
    sample_list = []

    # Iterate over each file in the folder
    for filename in os.listdir(folder_path):
        if filename.endswith('.csv'):
            # Read the CSV file, skipping the header
            file_path = os.path.join(folder_path, filename)
            df = pd.read_csv(file_path, header=None)

            print(df)
            sample_name = filename.replace('_results.csv', '')

            # Extract values and add to the list
            values = df.values.flatten()
            all_values.extend(values)
            sample_list.append(sample_name)

    print(all_values)

    # Create a new DataFrame with a single column
    consolidated_df = pd.DataFrame(list(zip(sample_list, all_values)),
              columns=['sample', 'area_cm2'])

    # Save the new DataFrame to a CSV file in the output folder
    output_file_path = os.path.join(output_folder, output_file)
    consolidated_df.to_csv(output_file_path, index=False)

# Usage example
folder_path = '/Users/admin/Desktop/ecogeno_important/clean_output_tables/'      # Replace with the path to your folder
output_folder = '/Users/admin/Desktop/ecogeno_important/final_output_table/'  # Replace with the path to your output folder
output_file = 'consolidated.csv'         # The name of the output file
consolidate_csv(folder_path, output_folder, output_file)
If you use this code, presumably you are a student of Ecogenomics. I suggest a few things. When photographing plants, create a little studio, that is a white or dark background with bright lights. We had problems with the greenhouse lights turning on and off creating dissimilar lighting conditions. You could add a color map to the pictures to also calculate average leaf color per plant, corrected with this map. There are some standard maps that a software like photoshop can use to correct the white balance of an image. I would just try to keep the lighting conditions similar and skip the map.
Look into the availability of deeplearning algorithms to improve the efficiency of this program. At the time of writing GPT is on the edge of handling large datasets, but it’s not quite there. Perhaps in a year you can just upload hundreds of raw images to an online data anaylis tool, and it will do everything for you based on deep learning.
I had fun on this little coding challenge, but I could not have done it without GPT. If you need to code for biology, it is your best friend.